It's an old story. A group of blind people want to know what an elephant looks like. One feels the elephant's trunk, another a leg, and another the tail. The first concludes that the elephant is like a snake, the second like a tree, and the third like a rope. It's impossible to get an accurate image of the whole elephant by examining only a few of its parts.
The story illustrates the problem of getting a fix on student achievement. Like the elephant, the subject of student achievement is big. A few pieces of data can give an incomplete picture—or worse, a misleading one.
To illustrate this point, let's look at a few examples that represent starting places for thinking about some little-recognized aspects of student achievement data. With a better understanding of the whole elephant, school leaders can not only make better use of test score data but also convey the meaning of these data more effectively to school personnel, students, and parents.
The Problem with Cut Points
A common approach in this era of test-based accountability is to measure student achievement in terms of how many students score at or above some predetermined "proficiency" level, which statisticians call a cut point. State and federal accountability systems, with a few exceptions, are nearly always set up this way.
Focusing on the cut point has at least one major drawback: It provides no information about changes in the achievement of students who remain above or below this point. Further, in a high-stakes environment, the use of a single cut point can have negative consequences, encouraging teachers to focus most of their attention on those students who are just below the cut point in an effort to boost them over the line so the school can show "improvement." Meanwhile, what's happening to students who are well above this cut point? What's happening to students who are so far below the cut point that there seems to be only a remote possibility of getting them above it before the next round of testing?
We need to consider measures that yield a broader understanding of student achievement. These measures could result in a better approach to accountability and a more equitable and effective distribution of precious instructional resources.
Looking at the Whole Distribution
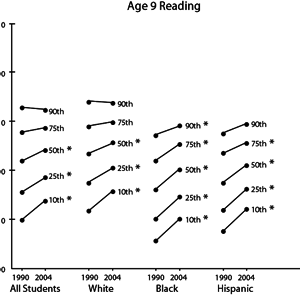
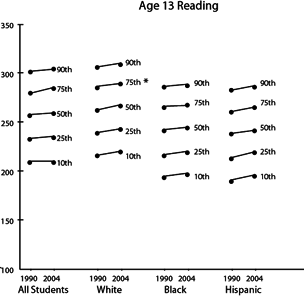
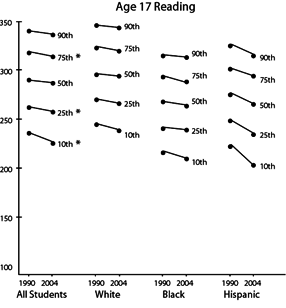
One way of moving beyond the cut point approach is to examine the whole distribution of scores by percentiles. Figure 1 (p. 32), taken from the long-term trend series of the National Assessment of Educational Progress (NAEP), illustrates some of the insights that we can gain from this approach.
Figure 1. Percentile Distributions of NAEP Reading Scores by Age and Racial/Ethnic Group, 1990 and 2004


* Indicates a statistically significant difference 1990 to 2004.
Source: Data from the National Assessment of Educational Progress analyzed by Educational Testing Service.
This figure shows average NAEP reading scores at selected percentiles for 1990 and 2004. We can see that 9-year-old students at the 50th, 25th, and 10th percentiles improved significantly, and students at the 90th and 75th percentiles decreased or did not improve significantly. When we look at different racial/ethnic groups, we see that black students showed significant gains at all percentiles and Hispanic students made significant gains at all but the 90th percentile during this period.
Now look at older students' reading scores. The contrast is striking. The total group of 13-year-old students showed no significant improvement at any percentile. Seventeen-year-old white, black, and Hispanic students showed declines at every level; and when all three racial/ethnic groups are added together, the sample is large enough to disclose that these declines were statistically significant at the 75th, 25th, and 10th percentiles.
The news was better in mathematics, where gains were made throughout most of the score distribution for 9- and 13-year-olds. But the mystery of the disappearing achievement gains has been evident during the last few decades. The student achievement gains we've seen at ages 9 and 13 typically disappear at age 17. Looking at achievement trends at different percentiles and at different ages can inform policymakers about where changes may or may not be occurring—where students are being helped and where they may be falling behind.
Looking at Quartiles
We can tell a more concise story by examining quartiles, calculating average scores for each quartile, and tracking changes. Ever since NAEP made such comparisons possible, the public has widely recognized that achievement gaps by race and ethnicity exist. But it may come as a surprise that the largest and only reduction in the minority achievement gap for 17-year-olds in reading, looking at black and Hispanic students combined, occurred from 1975 to 1990. From 1990 through 2004 (the most recent data available from the long-term NAEP), there has been no reduction in the gap. The reduction from 1975 to 1990 was large—the gap was nearly halved—and it happened across the board in all four quartiles (Barton & Coley, 2008).
Many people consider the period of the 1990s and early 2000s to be the time of the flowering of education reform, including the implementation of standards-based reform and test-based accountability. Why the reduction in the minority achievement gap for older students stopped during this period—and why the large gap reduction between 1975 and 1990 occurred in the first place—is unknown. We should seek the answer as policymakers craft new programs to raise overall levels of student achievement and to close the achievement gap.
End-of-Year Comparisons vs. Gains
There has been considerable debate in the United States, particularly since the passage of No Child Left Behind (NCLB), about how to use test scores to set standards for accountability. NCLB uses end-of-year test scores to determine how many students meet a set level of proficiency, thus comparing different cohorts of students each year. We have been among those arguing that we would get more useful information by measuring how much students gain in knowledge during the school year. A considerable number of studies have shown that schools found to be "failing" on one measure are not "failing" on the other. That is, there is a low correlation between the results obtained by the two different measures (Barton, 2008).
Data from the National Assessment of Educational Progress illustrate this discrepancy. NAEP reports results in terms of end-of-year scores: for example, by comparing 8th graders in 1996 with 8th graders in 2000. In contrast, to obtain a view of "growth," we would calculate how much the scores of students who were 4th graders in 1996 grew by the time they were in 8th grade in 2000. (For a discussion of the statistical and measurement challenges inherent in this latter approach and a comparison of how the various states did on each of the two measures, see Coley, 2003).
The differences in state rankings in student achievement on NAEP using these two measures are large. For example, at the end of grade 8, Maine ranked number one in "level of knowledge," with an average score of 273 on the 0–500 scale. However, it placed fourth from the bottom in terms of the gain in scale points from 4th to 8th grade (Barton & Coley, 2008).
These two methods will produce similar disparities in the rankings of individual schools. A school that does not make adequate yearly progress as measured by end-of-year comparisons may actually be doing well in terms of student gains during the year, whereas a school showing high end-of-year test scores may be doing poorly if we look at how much its students are gaining during the year.
A Panoramic View of Achievement Inequality
The purpose of disaggregating achievement test scores is to gain insight about inequality and achievement gaps. The most informative view of these gaps is seen by looking at the full distribution of achievement scores from top to bottom, as well as looking at scores of students of different ages and grades side by side. NAEP long-term trend data permit such analysis on an age basis, as we saw in Figure 1. The degree of overlap in the score distributions of 9-year-old students, 13-year-old students, and 17-year-old students is substantial. When we display such a chart during speeches, the gasp from audiences is sometimes audible.
The bottom line: In reading, about the bottom one-fourth of 17-year-olds score at about the same level as do the top one-tenth of 9-year-olds. This wide range of achievement levels occurs within each racial/ethnic group to varying degrees. However, overlaps also shed light on the differences between racial/ethnic groups. For example, the distribution of scores for 17-year-old black and Hispanic students looks similar to that for 13-year-old white students.
When we see such huge disparities in achievement among students of the same age and grade, it is hard to understand what the frequently used phrase being on grade level means. Across the United States, students in every grade fall at different points in an achievement range that starts very high and ends very low; there is nothing "level" about it.
Achievement Gap Misunderstandings
No Child Left Behind requires states to "close the achievement gap" and bring all racial and ethnic subgroups to the same level—or so it has been widely declared. However, the law is precise in what it says, and although its successful operation might well narrow achievement gaps, it does not require that they be closed.
NCLB requires only that all defined population subgroups reach the "proficient" level a state has established. But even if all the subgroups increase their scores to above the cut point, the gaps between average scores of different groups may remain. In addition to tracking the gap in the percentage of subgroups reaching a particular cut point, we need to measure and compare the average scores in each subgroup to identify whether gaps are being reduced or closed (Holland, 2002).
The difference between using a cut point standard and an average score is seen in the 2007 NAEP mathematics data for 8th graders. The gap between white and black students varies depending on whether we compare the difference in average scores or the percentage reaching the basic or proficient level. West Virginia, for example, has a 21-point gap in average scores, a 32-point gap in the percentage of students reaching the basic level, and only a 15-point gap in the percentage of students reaching the proficient level. Massachusetts, on the other hand, has a 40-point gap in average scores, a 37-point gap in the percentage of students reaching the basic level, and a 45-point gap in the percentage of students reaching the proficient level (Barton & Coley, 2008).
If ever the circumstance arose, some states might be shocked to find they have met the required proficiency levels for each subgroup while maintaining exactly the same gaps in average scores that they had before.
Giving More Meaning to Test Scores
- A student with a scale score of 259 would probably be able to recognize misrepresented data.
- A student with a score of 305 could probably identify fractions listed in ascending order.
- A student with a score of 355 would most likely be able to estimate the side length of a square, given the area.
From the standpoint of the student, the parent, the public, and the teacher, a "scale score" on a standardized test can be abstract and uninformative. Item mapping provides better information about what students can and cannot do. And reviewing this information for subgroups of students can help policymakers better comprehend the meaning of the achievement gap.
The Goal: Better Understanding
Test score data are abstract—and important. Here, we have described different methods for clarifying the meaning of test scores, using data available from the National Assessment of Educational Progress. When education leaders apply similar methods to clarify meaning of test scores at the state and local level, they are rewarded by a better understanding of student achievement, greater public acceptance of important decisions that affect students, and greater success in using tests to improve teaching and learning.

